How to optimize React using React DevTools
React, as a front-end view library, is fast enough for most situations. However, there are times when certain user flows slow down, and we need to optimize the components causing the issues. We can investigate and resolve these problems using React DevTools.
What is React DevTools?
The React DevTools is the official browser extension available for Chrome, Firefox, and Edge. It is a set of tools that enables us to debug and analyze React components, such as their hierarchy and performance.
Installation and usage
After installing the extension, open the browser’s devtools on any webpage that uses React. You will see two new panels added by React DevTools.
Components panel
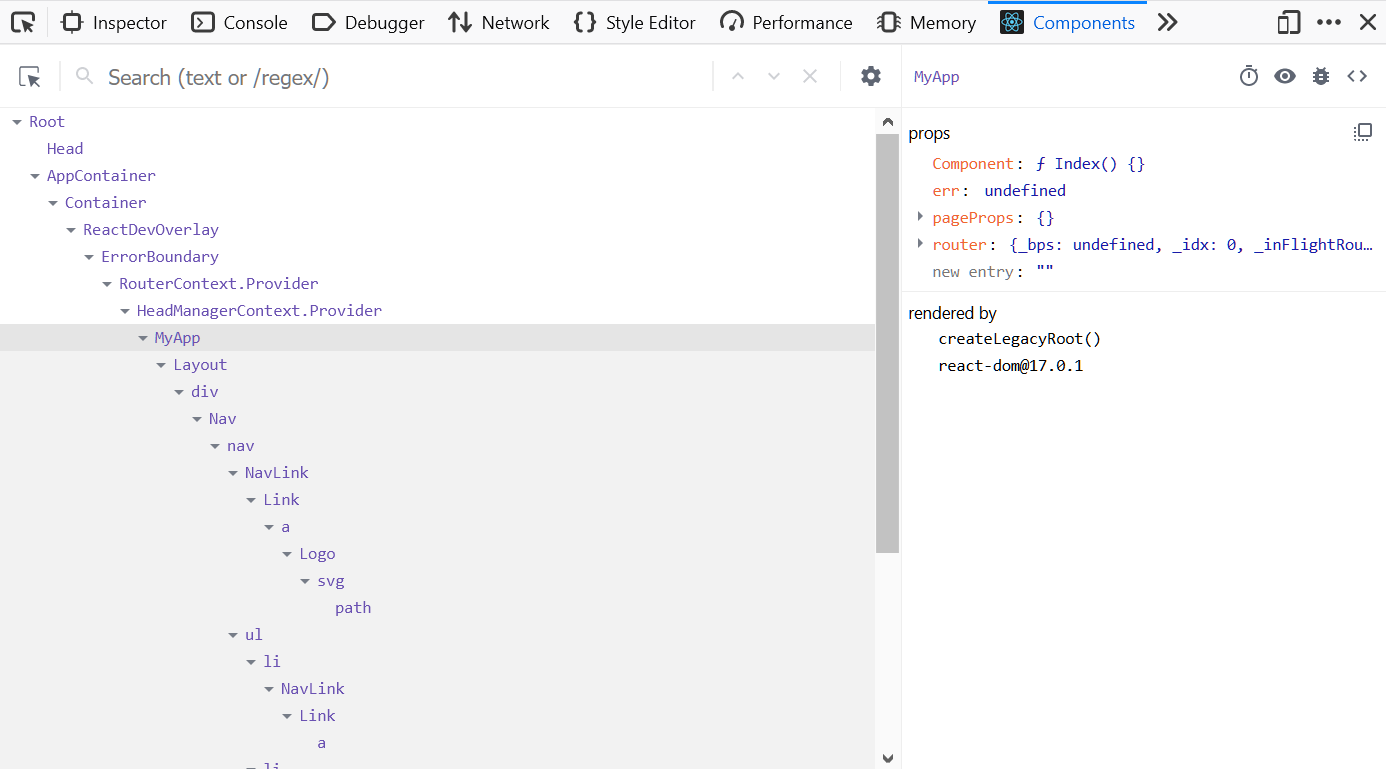
The first tool is the Components panel. It allows you to visualize the hierarchy of React components, as well as the props and state of each individual component.
Profiler panel
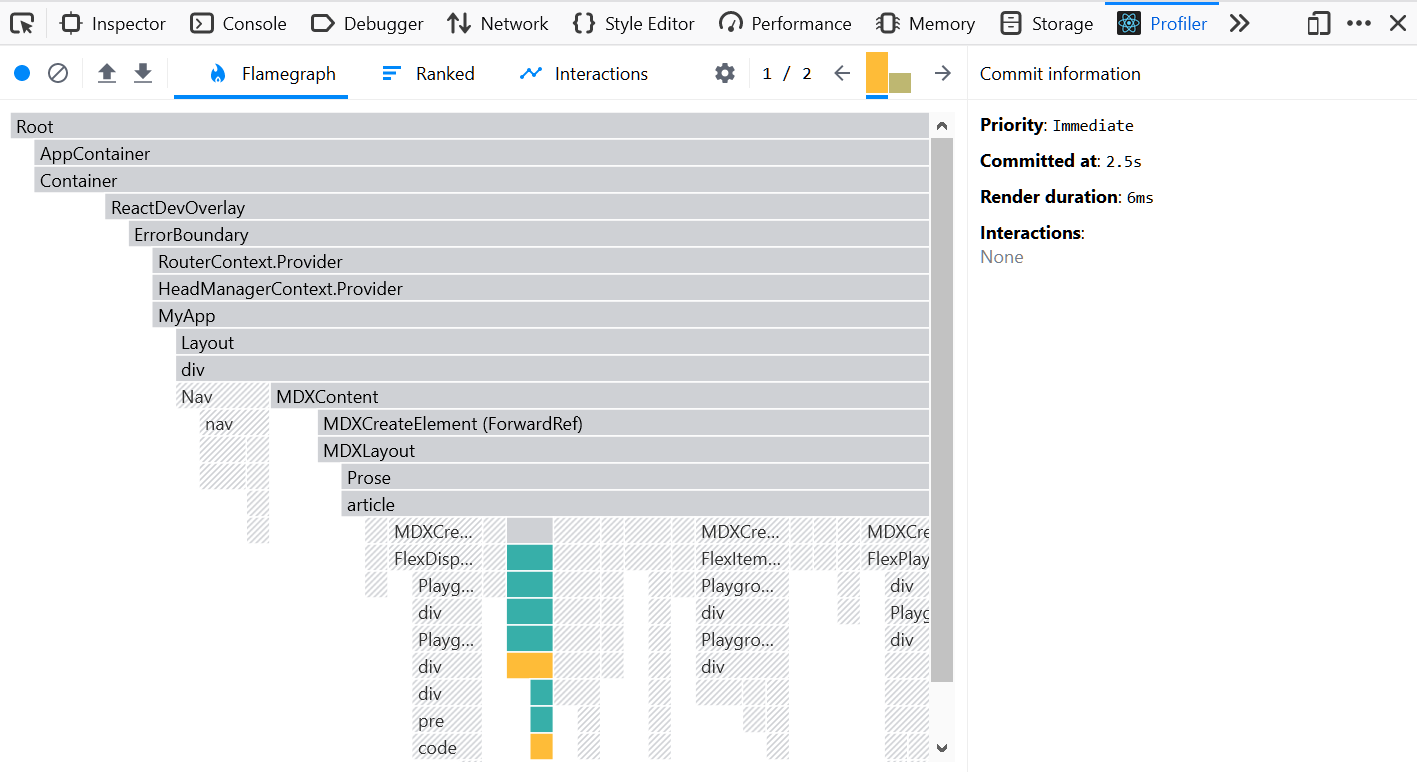
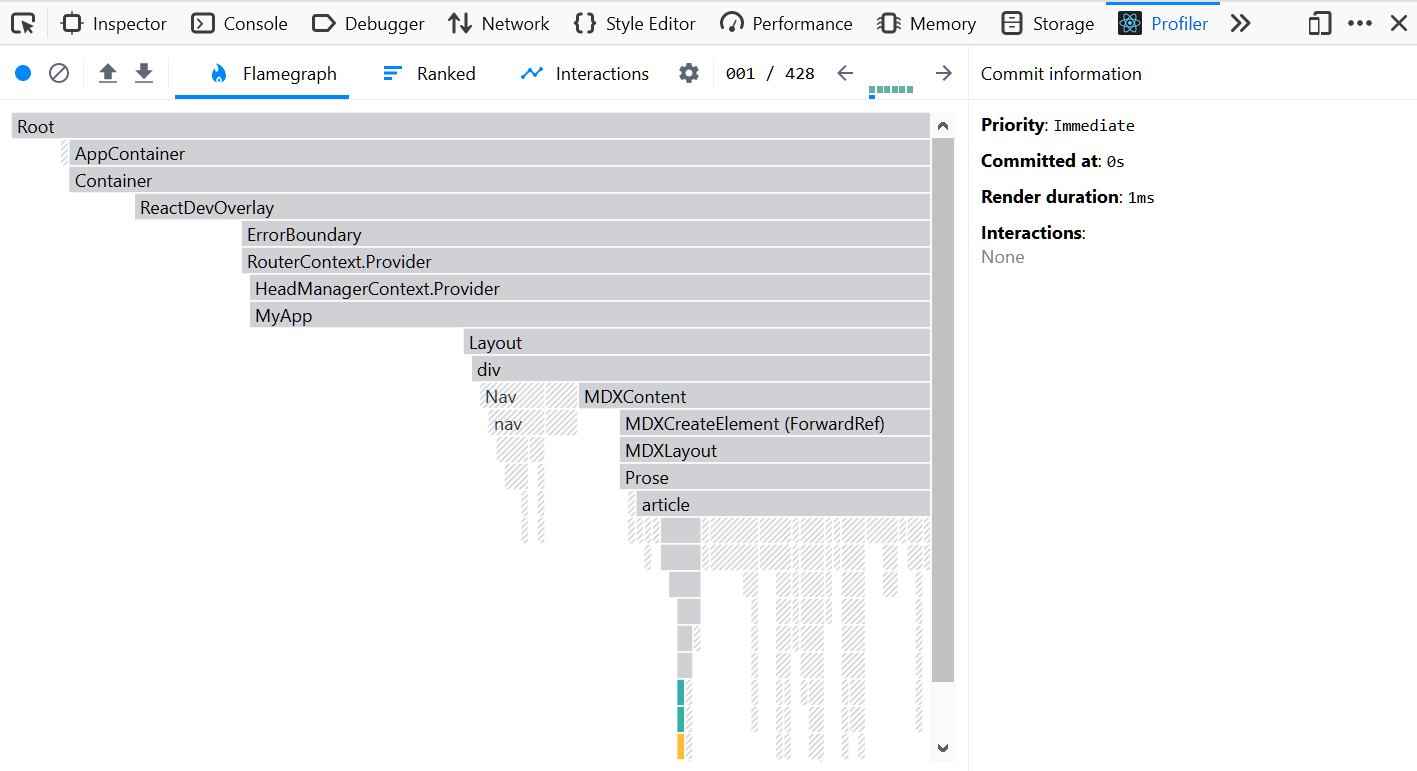
The Profiler panel is the primary tool we will use to optimize slow React components. After recording a specific flow, it generates a flame graph, as shown above.
The flame graph visualizes the time spent rendering each component, including the time taken to render its children. This is why the Root component occupies the entire first row in the graph, with each subsequent child being shorter.
One confusing aspect of reading this graph is that only the colored components have rendered during the current frame. The length of the grayed-out components indicates the time they took to render before profiling.
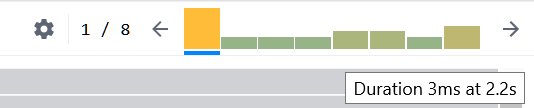
In the top right corner, there is a bar chart. Each bar represents a render, and its height and color indicate the duration it took to render. Hovering over a bar reveals how long the phase took and when it started.
The right commit information sidebar also provides useful data:
- Priority: The priority of the rendering component, which may vary under concurrent mode
- Committed at: The time of the React commit phase since pressing the record button
- Render duration: The time required to complete rendering after the commit phase
- Interactions: User interactions, such as clicks
How to find slow components
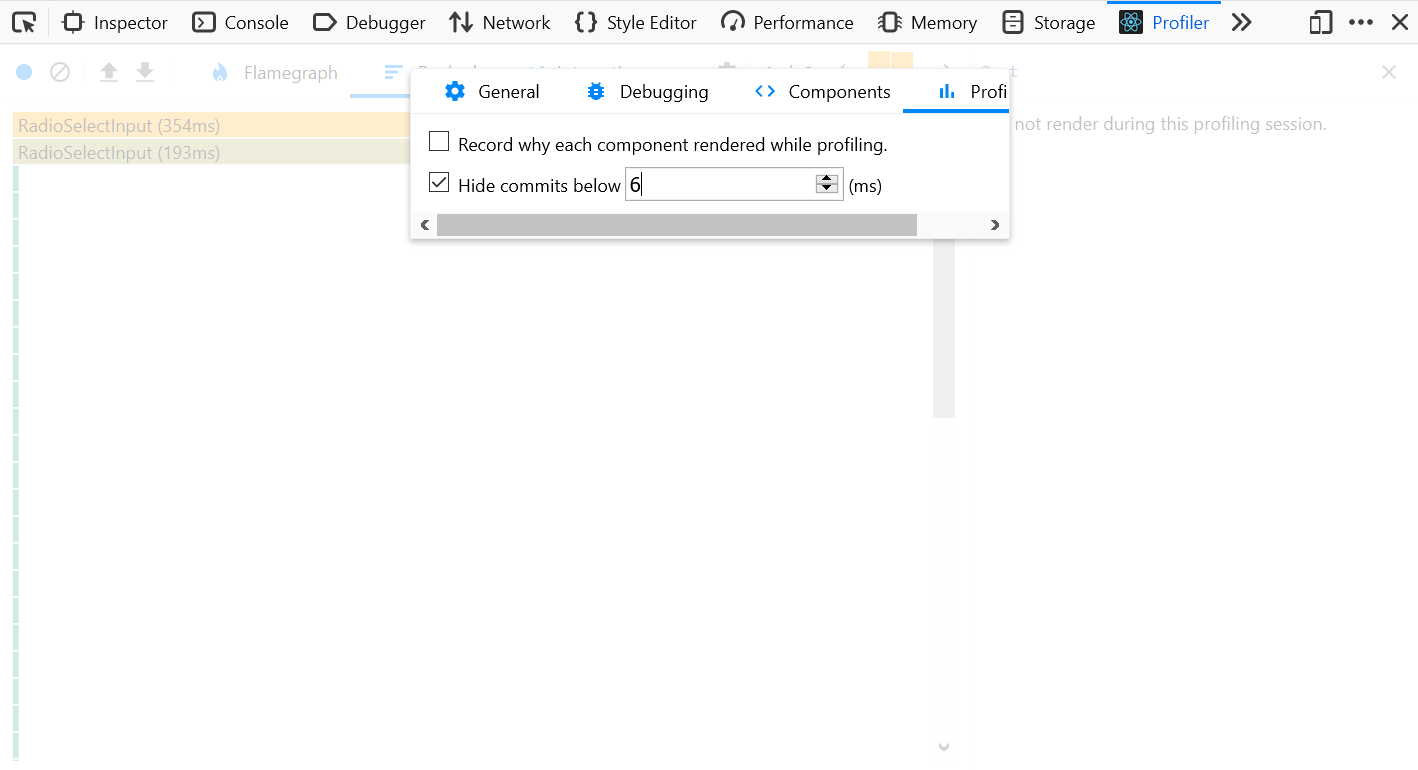
The quickest way to identify components that need immediate attention is to hide commits below a certain threshold. Ideally, we want our UI to run smoothly at 60 frames per second (fps), which means any commit taking longer than 16 milliseconds will cause a dropped frame. However, as developers, we typically have access to the best equipment, so lowering this threshold to 6-8 milliseconds provides a more realistic view of our users’ experience.
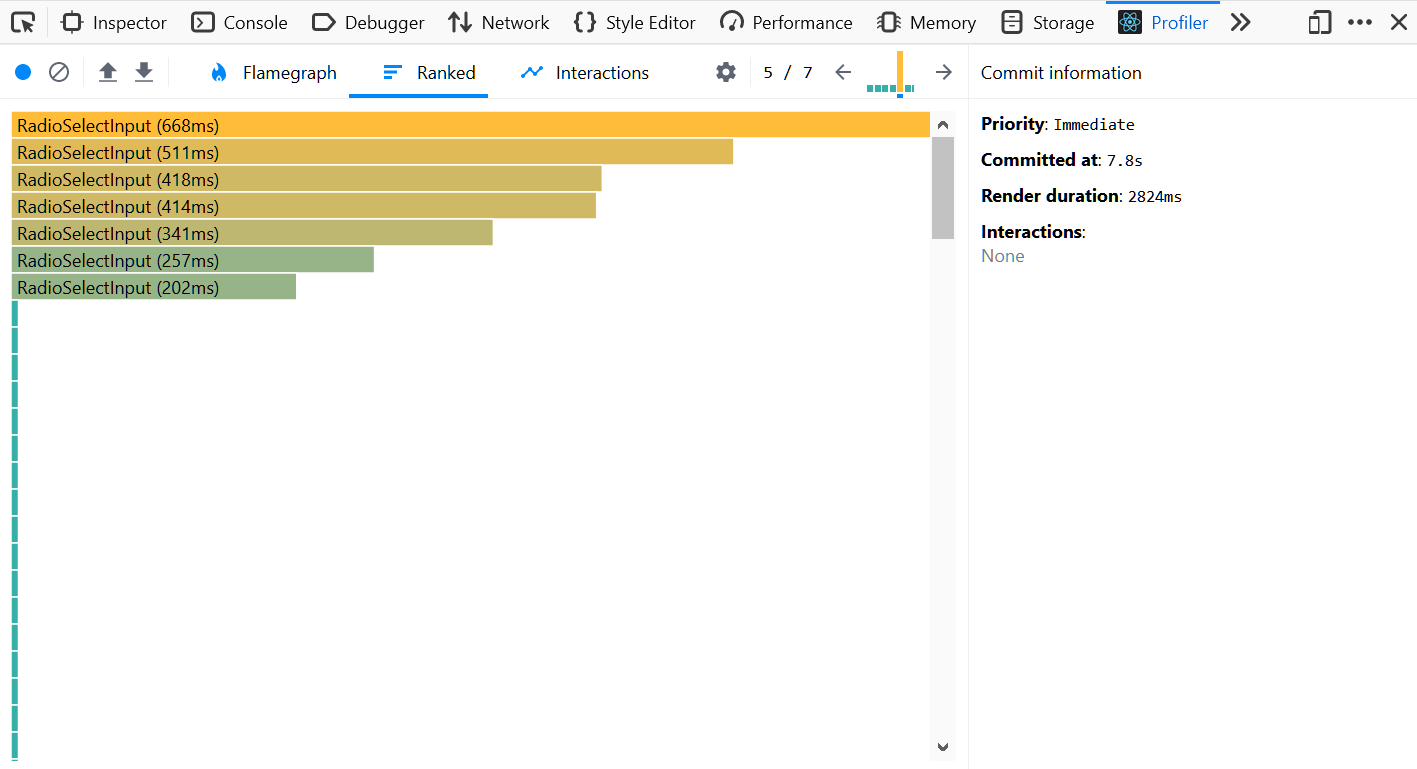
After recording a session, we can review all the rendering phases that exceeded our desired threshold in the top right corner of the profiler. The slowest phases will appear taller and more yellow. In addition to the flame graph, we can use the “Ranked” subpanel to identify which components in the tree took the longest to render.
In most cases, this is how you can find problematic components. However, there may be instances where every phase appears fast, yet the number of phases exceeds hundreds.
Optimizing React components
There are three common reasons why a component may be slow. We will discuss each case and suggest solutions.
Fixing components that re-render needlessly
When a component has many child components, re-rendering the entire subtree can become costly, so we should avoid it when unnecessary.
Unnecessary re-renders can be identified by checking if the props, state, and hook results remain the same as in the previous render. The Why Did You Render library can help automate this process.
In the example below, the ExpensiveComponent re-renders every time the increment button is clicked, even though it doesn’t need to.
function App() {
  const [counter, setCounter] = useState(0);

  return (
    <>
      <button onClick={() => setCounter((count) => count + 1)}>
        increment
      </button>
      <ExpensiveComponent style={{ display: 'flex' }} />
    </>
  );
}

function ExpensiveComponent(props) {
  return (
    <ul style={props.style}>
      {Array(500)
        .fill()
        .map((val) => (
          <li>val</li>
        ))}
    </ul>
  );
}
Resolving this issue is quite simple. First, ensure that the props, state, and hook results remain shallowly equal during re-renders. You can achieve this easily by using the useMemo hook, as shown below:
function App() {
  const [counter, setCounter] = useState(0);
  const style = useMemo(() => ({ display: 'flex' }));

  return (
    <>
      <button onClick={() => setCounter((count) => count + 1)}>
        increment
      </button>
      <ExpensiveComponent style={style} />
    </>
  );
}
Next, wrap the top-level component with React.memo. This way, if the component receives props that are shallowly equal to those from the previous render, it will skip the rendering step.
const ExpensiveComponent = React.memo((props) => {
  return (
    <ul style={props.style}>
      {Array(500)
        .fill()
        .map((val) => (
          <li>val</li>
        ))}
    </ul>
  );
});
Fixing expensive components
This situation occurs when your component has many child components or performs heavy calculations. Solving this can be challenging because your options are limited.
If your component takes a long time to render due to many child components, consider using virtualization (also known as windowing) libraries like react-window and react-virtualized. These libraries help by rendering only the child components that are visible in the viewport, rather than all of them at once.
If the component is performing heavy calculations, depending on the intensity of the calculations, you might want to run them on the server-side or in a Web Worker. If neither option is feasible, chunking the calculations may help alleviate the issue, as React will be able to render the component more frequently, like this:
const CHUNK_SIZE = 1000000;

function ExpensiveCalculationComponent({ total }) {
  const [result, setResult] = useState(null);
  const [index, setIndex] = useState(0);

  while (index < total) {
    setIndex((index) => {
      const nextIndex = Math.min(index + CHUNK_SIZE, total);
      for (let i = index; i < nextIndex; i++) {
        // ... do heavy calculations for this chunk
      }
      if (nextIndex === total) {
        setResult(sum);
      }
      return nextIndex;
    });
  }

  return <div>{result}</div>;
}
Fixing components that re-render too many times
A clear sign of this problem is when the profile shows hundreds of frames. Components that re-render too frequently typically do not impact the user’s experience, but they can lead to unnecessary power consumption and complicate profiling by cluttering the bar chart in the top right.
Animation or timers often cause this issue, as shown in the example below:
function Spinner() {
  const [degrees, setDegrees] = useState(0);

  useEffect(() => {
    const id = setInterval(() => {
      setDegrees((deg) => (deg + 1) % 360);
    }, 16);
    return () => clearInterval(id);
  }, []);

  return <SpinSVG style={{ transform: `rotate(${degrees}deg)` }} />;
}
In this case, it might be beneficial to move the animation logic outside of React. This change can lead to more efficient code by avoiding React’s diffing process.
function Spinner() {
  const divRef = useRef();

  useEffect(() => {
    let degrees = 0;
    const id = setInterval(() => {
      degrees = (degrees + 1) % 360;
      divRef.current.style.transform = `rotate(${degrees}deg)`;
    }, 16);
    return () => clearInterval(id);
  }, []);

  return <SpinSVG ref={divRef} />;
}
Conclusion
By keeping the UI responsive, you not only enhance your users’ experience but also simplify debugging and future improvements to the application. Once you master React DevTools, finding and optimizing slow components becomes straightforward. So, get out there and start enhancing your app!